Journal of Animal Health and Production
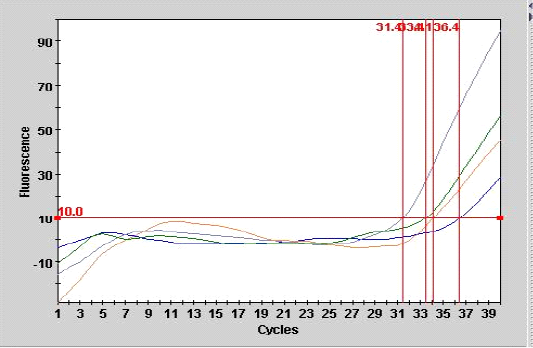
Smart cycle fluorography illustrating the RT-PCR detection of viral nucleic acid for the matrix gene of sample from experimentally infected chickens with LPAIV (H9N2).
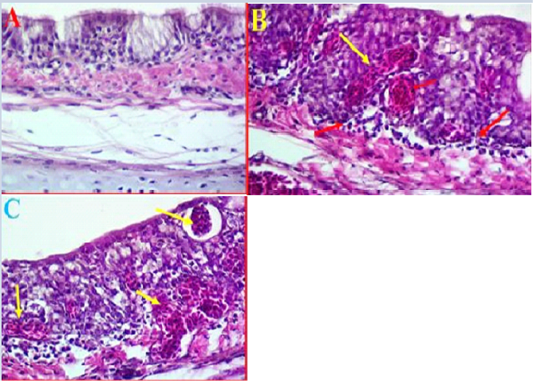
A- Histological changes in trachea of chickens infected with avian influenza (norml trachea). (40X, H&E). B- showed a clear degeneration in the epithelium and mucus gland with sever congestion and haemorrhage in trachea due to infected with LPAIV H9N2 (yellow arrows) (40X, H&E). C- Shows some pathological changes in trachea exhibited haemorrhage extended to sub mucosa and there was also observed vacuoles filled with blood (yellow arrows) (40X, H&E).
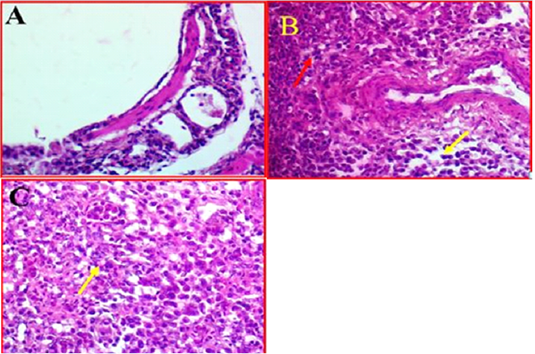
A-Photomicrographs illustrates the control bronchial tree and lung tissue. 40X (40X, H&E). B- Shows the local infiltration of inflammatory cells represented by red arrows, whereas yellow arrows indicated the mononuclear inflammatory cells, while. (40X, H&E). C- shows thickened in bronchioles wall (Yellow arrow). (40X, H&E).
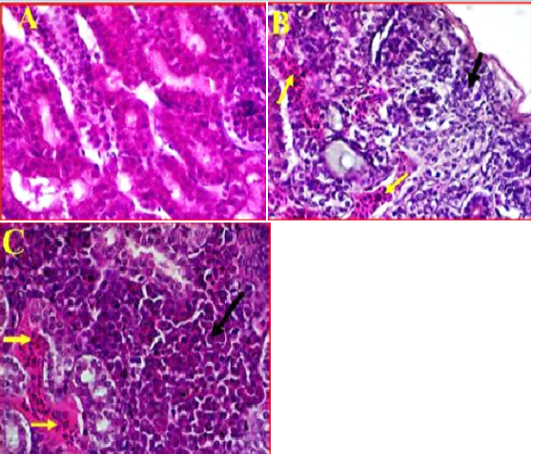
A- Illustrates a cross section of control or normal kidney tissue. (40X, H&E). B- shows the pathological changes exhibited in cortical region accompanied with sever infiltration with the inflammatory cells (black arrow) and sever congestion (Yellow arrows). (40X, H&E). C- shows multifocal necrosis and sever degeneration on the subcapsular area extended towards the medullary cones. (40X, H&E).
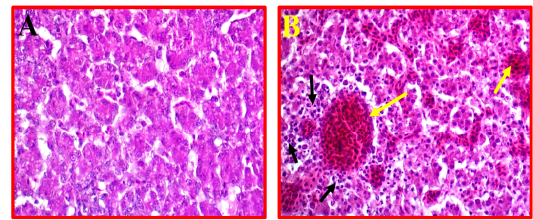
Shows control or normal liver. (40X, H&E). B- Illustrates pathological changes appeared as multifocal necrosis accompanied with infiltration with the many inflammatory cells (black arrows) and sever congestion (yellow arrows). (40X, H&E).
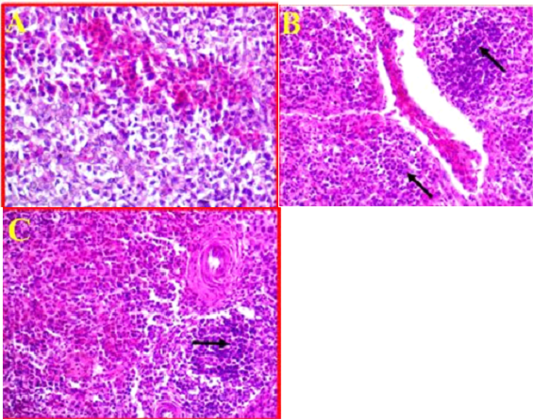
A- Illustrates a cross section of control or normal spleen. (40X, H&E). B- Shows the pathological changes revealed in splenic parenchyma accompanied with sever infiltration with the inflammatory cells (black arrows) and sever congestion. (40X, H&E). C- Shows inflammatory cells observed in peri-arteriolar sheaths with the prominent of fibrinoid necrosis. (40X, H&E).
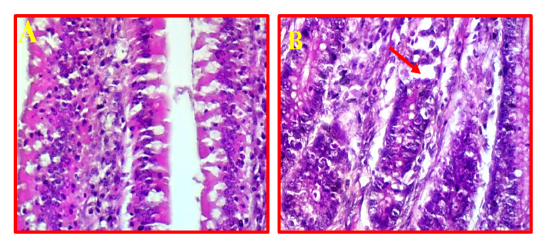
A- Shows normal intestine. (40X, H&E).B- Illustrates mild pathological changes presented in mucosal layer (red arrows). (40X, H&E).


