Advances in Animal and Veterinary Sciences
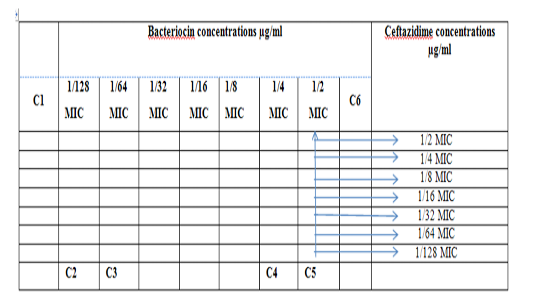
Diagram of the checkerboard assay shows wells concentrations of Bacteriocin and Ceftazidime. C1 = broth alone (no bacterial inoculum), C2 = broth+ indicator + org, C3 =broth+indicator, C4 = Ceftazidime alone, C5 = D.W. alone and C6 = Bacteriocin alone.
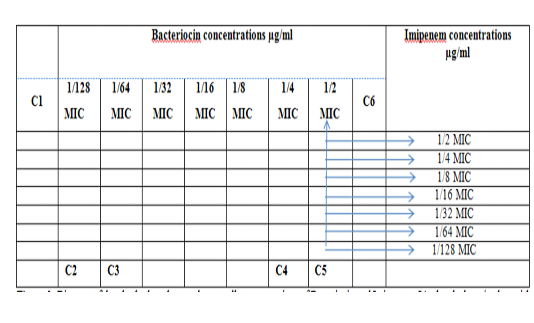
Diagram of the checkerboard assay shows wells concentrations of Bacteriocin and Imipenem. C1 = broth alone (no bacterial inoculum), C2 = broth+ indicator + org, C3 =broth +indicator, C4 = Imipenem alone, C5 = D.W. alone and C6 = Bacteriocin alone.
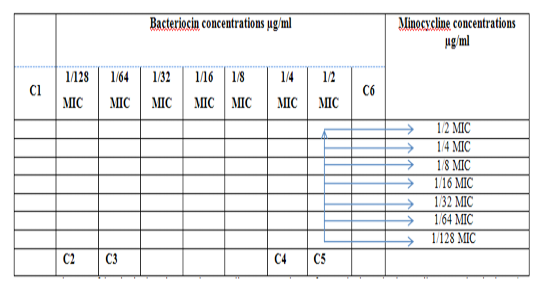
Diagram of the checkerboard assay shows wells concentrations of Bacteriocin and Minocycline. C1 = broth alone (no bacterial inoculum), C2 = broth+ indicator + org, C3 =broth +indicator, C4 = Minocycline alone, C5 = D.W. alone and C6 = Bacteriocin alone.
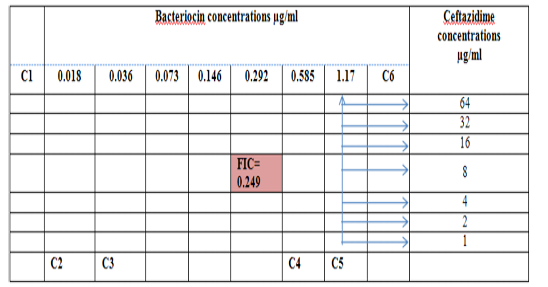
Diagram of the checkerboard assay shows well concentration of Bacteriocin and Ceftazidime. C1 = broth alone (no bacterial inoculum), C2 = broth+ indicator + org, C3 =broth +indicator, C4 = Ceftazidime alone, C5 = D.W. alone and C6 = Bacteriocin alone.
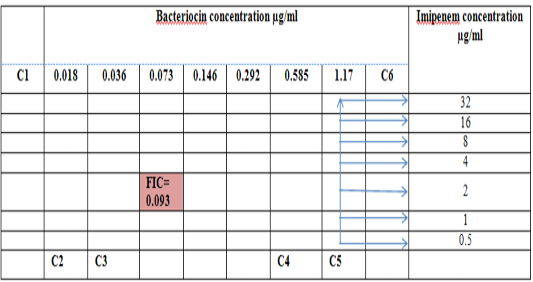
Diagram of the checkerboard assay shows well concentration of Bacteriocin and Imipenem. C1 = broth alone (no bacterial inoculum), C2 = broth+ indicator + org, C3 =broth +indicator, C4 = Imipenem alone, C5 = D.W. alone and C6 = Bacteriocin alone.
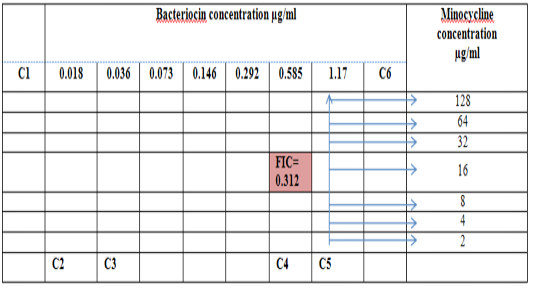
Diagram of the checkerboard assay shows well concentration of Bacteriocin and Minocycline. C1 = broth alone (no bacterial inoculant), C2 = broth+ indicator + org, C3 =broth +indicator, C4 = Minocycline alone, C5 = D.W. alone and C6 = Bacteriocin alone.
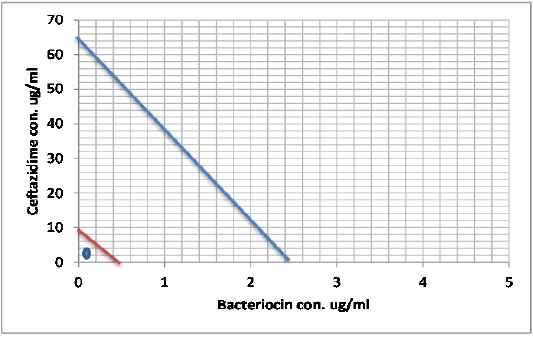
Minimum inhibitory concentration of Ceftazidime and Bacteriocin before and after combination by Isobolographic analysis.
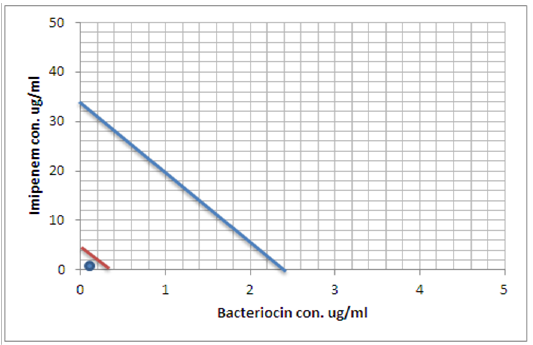
Minimum inhibitory concentration of Imipenem and Bacteriocin before and after combination by Isobolographic analysis.
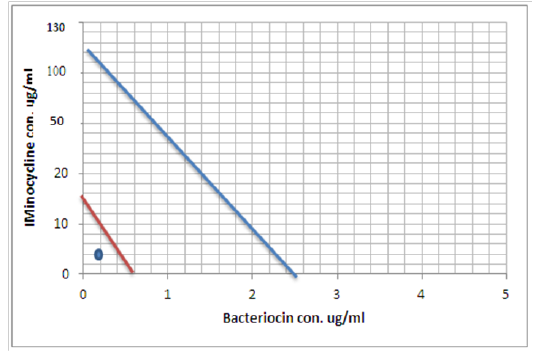
Minimum inhibitory concentration of Minocycline and Bacteriocin before and after combination by Isobolographic analysis


