Advances in Animal and Veterinary Sciences
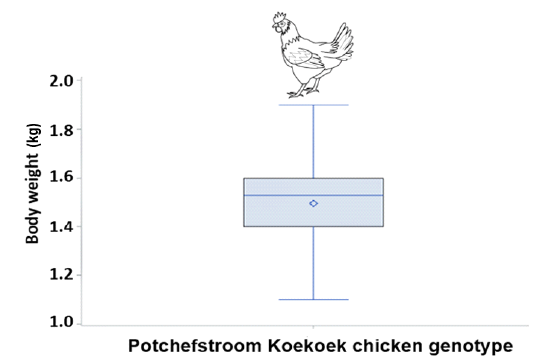
Boxplot showing the median, minimum, maximum, 25th and 75th percentile values of body weight of Potchefstroom Koekoek hens.
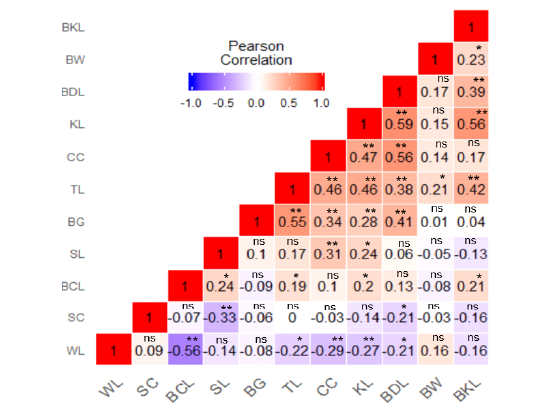
Heat map of phenotypic correlation of body weight and body measurement traits of Potchefstroom koekoek chicken genotype. Pearson correlation colour illustration, a high correlation is red, mid correlation is white and low correlation is blue. Body weight: BW, Beak length: BKL, Body length: BDL, Keel length: KL, Chest circumference: CC, Toe length: TL, Body girth: BG, Shank length: SL, Back length: BCL, Shank circumference: SC, Wing length: WL, * significant at p < 0.05, ** significant at p < 0.01 and ns not significant.
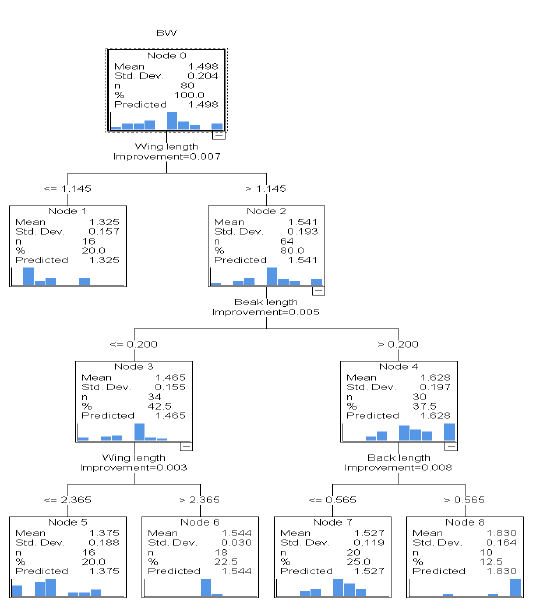
Classification and regression tree for modelling of body weight from linear body measurement traits in Potchefstroom chicken hens. Std. Dev = standard deviation, n = number, Mean = average, BW = body weight.


