Advances in Animal and Veterinary Sciences
Cholesterol levels in different groups, P value and the significance was measured (* p < 0.05 vs. OXO).
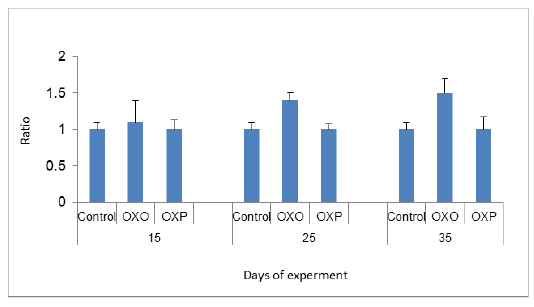
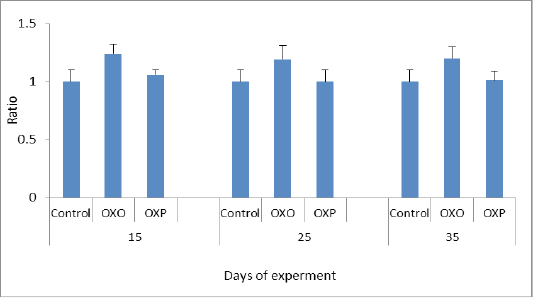
Uric acid ratio in different groups across days of experiment. P value and the significance was measured (* p < 0.05 vs. OXO).
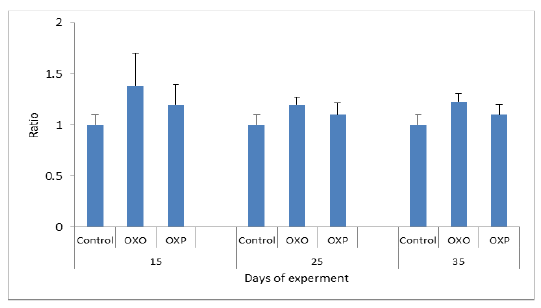
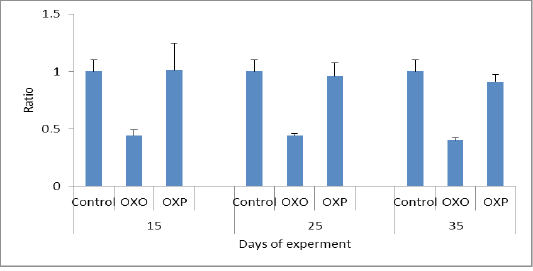
Creatinine ratio in different groups across experiment. P value and the significance was measured (** p < 0.01 vs. OXO).
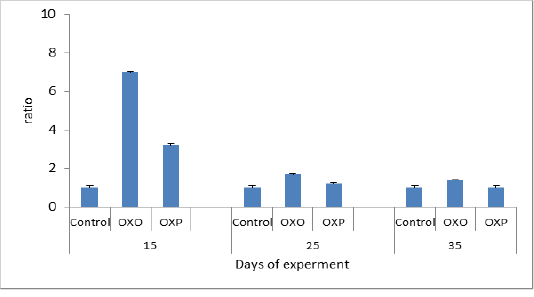
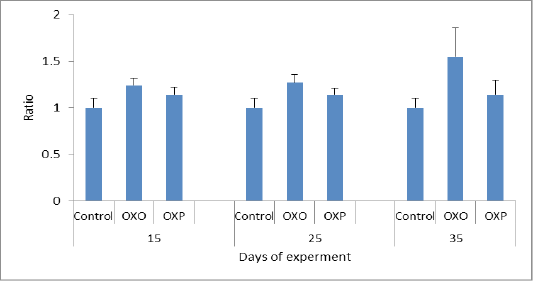
ALT ratio in different groups across experiment. P value and the significance was measured (** p < 0.01 vs. OXO).
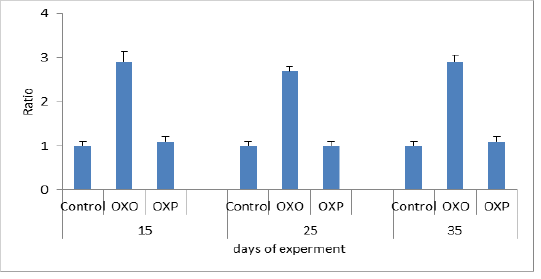
AST ratio in different groups across experiment. P value and the significance was measured (* p < 0.05 vs. OXO).
De rittis coefficient
.
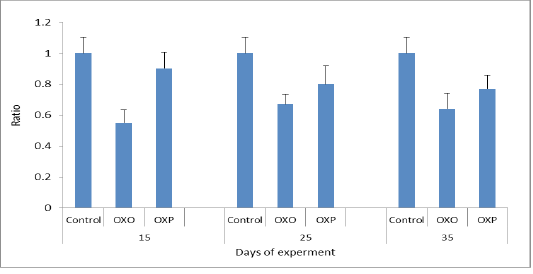
MDA ratio in different groups across the experiment. MDA P value and the significance was measured (* p < 0.05 vs. OXO).
TAC ratio in different groups across the experiment. P value and the significance was measured (** p < 0.01 vs. OXO).


