Advances in Animal and Veterinary Sciences
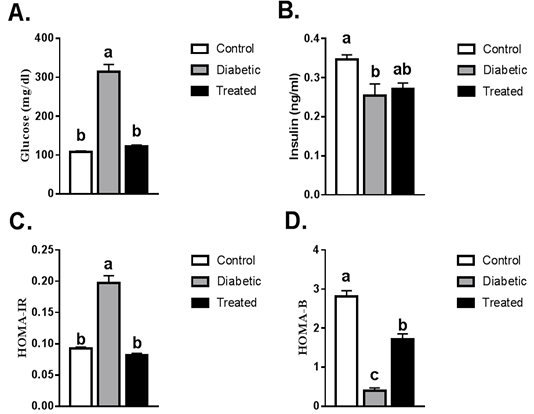
Serum levels of fasting blood glucose, insulin, HOMA-IR and HOMA-β. Values are mean ± SEM (8-10 rats/group). Means with different superscript were statistically different at p ≤ 0.05.
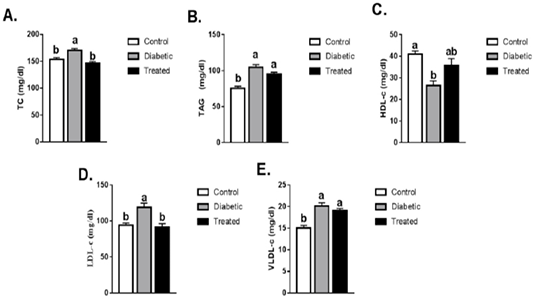
Means ± SEM of lipid profile (TC, TAG, LDL-c, HDL-c, VLDL-c). Values are mean ± SEM (8-10 rats/group. Means with different superscript are statistically different at p ≤ 0.05.
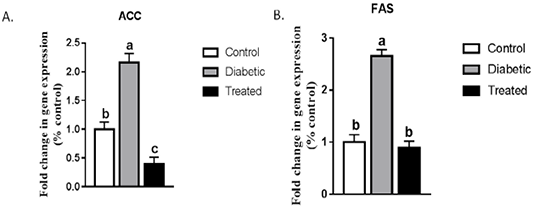
Effect on hepatic mRNA expression of (a) ACC and (b) FAS in adult male rats. Means with different superscripts are significantly different at P < 0.05.
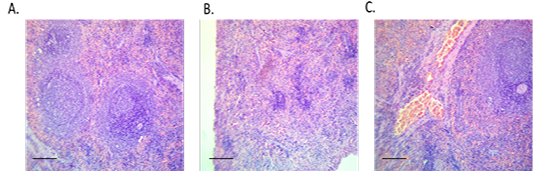
Spleen sections from control, diabetic or treated group. (A) Spleen of control rat showing normal histological picture (red and white pulps), H and E, x10, (B) Spleen of diabetic rat showing lymphoid depletion (shrunken white pulps), H and E, x10 and (C) Spleen of treated rat with the conjugate showing moderate vascular congestion, H and E, x10.


