Advances in Animal and Veterinary Sciences
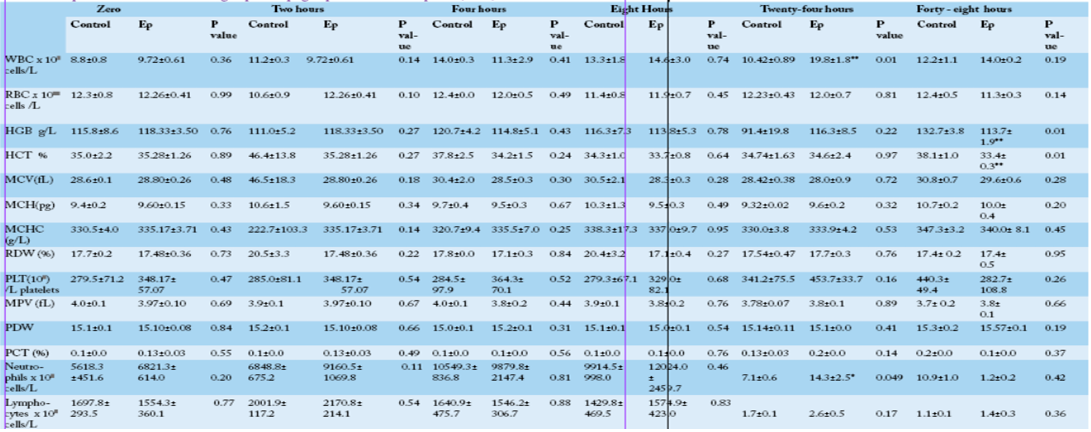
Complete blood count of control group and Ep- group at different time points (t-test)
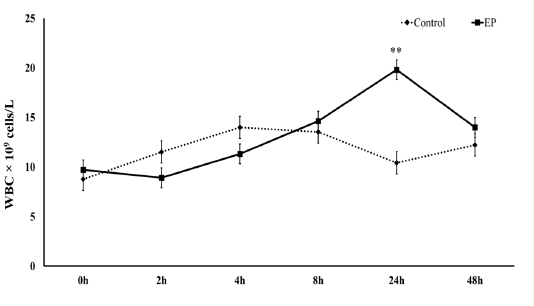
White blood cells count at 0 h, 2 h, 4 h, 8 h, 24 h and 48 h post-injection in the control and Ep groups. The average values (mean ± S.D.) are shown. Asterisks (**) indicate significant differences with a significance level of p ≤ 0.01.
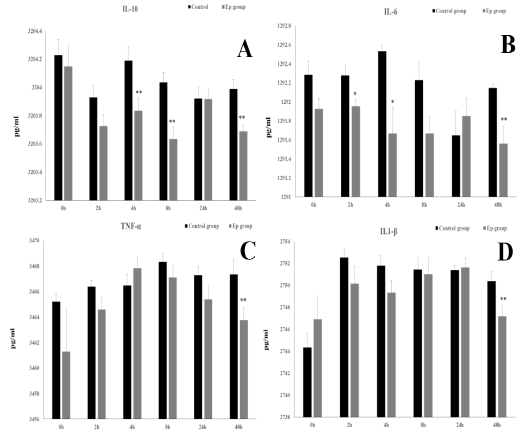
Mean serum cytokine levels [IL-10 (A), IL-6 (B), TNF-α (C) and IL1-β (D)] at 0 h, 2 h, 4 h, 8 h, 24 h and 48 h post-injection in the control and Ep groups. Asterisks (* and **) indicate significant differences with significance levels of p ≤ 0.05 and p ≤ 0.01, respectively.
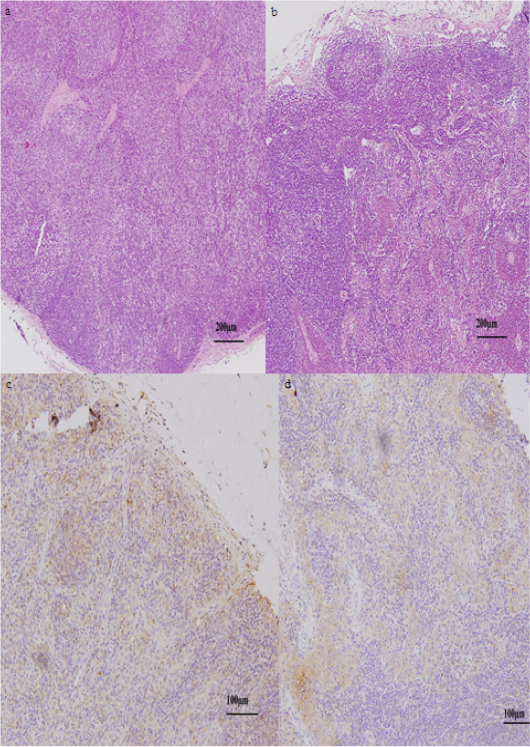
Lymph nodes of sheep at 4 hpi. (a). Normal histoarchitecture of lymphatic tissue of the control group. (b) Liquefactive degeneration found in some areas of the lymph node of the Ep group. Immunohistochemical expression in the control (c) and Ep (d) groups, (brown) as TLR4 stanning and (blue) as cells nuclei.


