Advances in Animal and Veterinary Sciences
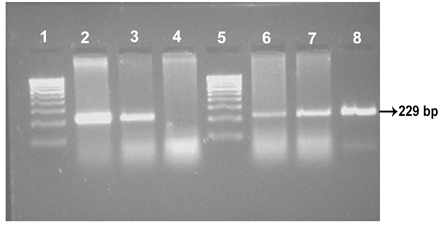
IS 900 PCR for MAP confirmation of the isolates showing 229 bp amplicon
Lane 1 & 5:100 bp DNA marker; Lane 2: ABT Cattle isolate; Lane 3: URF Cattle isolate; Lane 4: Negative control: Lanes 6, 7, 8: MVC Goat, MVC cattle and Ooty sheep isolates, respectively.
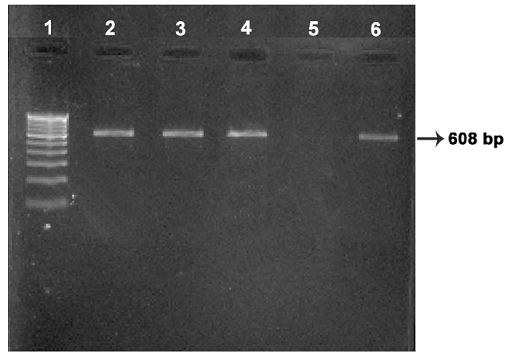
IS 1311 PCR of the isolates showing 608 bp amplicon
Lane 1: 100 bp DNA marker; Lanes 2, 3, 4: Ooty sheep, URF cattle, MVC cattle isolates respectively; Lane 5: Negative control: Lane 6: MVC goat isolate.
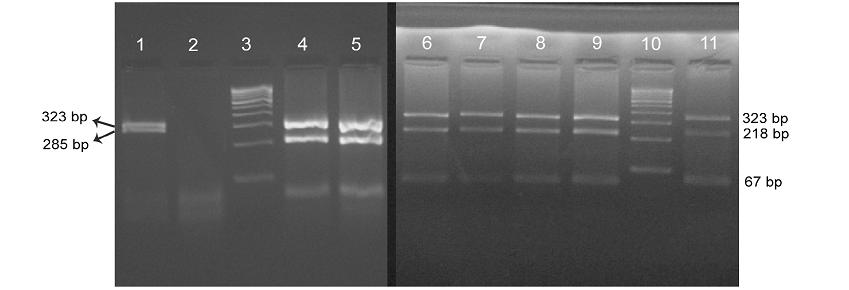
IS 1311 PCR-Restriction enzyme analysis using Hinf 1, Mse 1 of the isolates
Lane 3 & 10: 100 bp DNA marker; Lane 1: Ooty sheep showing ‘Sheep type’ IS 1311 band profile with 323 bp and 285 bp band; Lane 4-9: BV-l & ll sheep, ABT/MVC/URF cattle, MVC goat isolates, repectively, showing ‘bison type’ pattern with 323 bp, 218 bp and 67 bp fragments; Lane 11: BV-ll isolate.
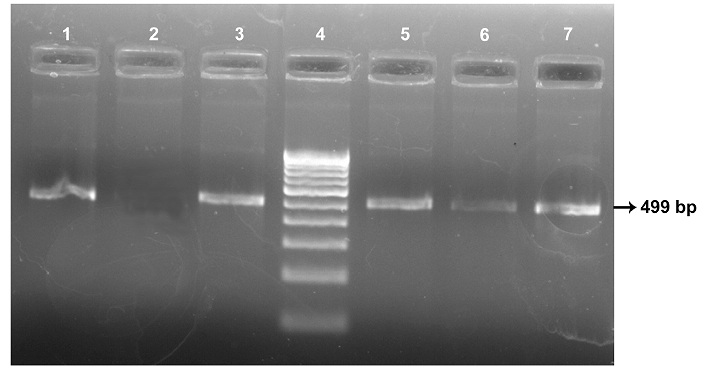
MAP 1506 PCR of the isolates showing 499 bp amplified product
Lane 4: 100 bp DNA marker; Lane 1: ABT cattle isolate; Lane 2: Negative Control; Lane 3: Ooty sheep isolate; Lane 5, 6, 7: MVC goat, MVC cattle and URF cattle isolates, respectively.
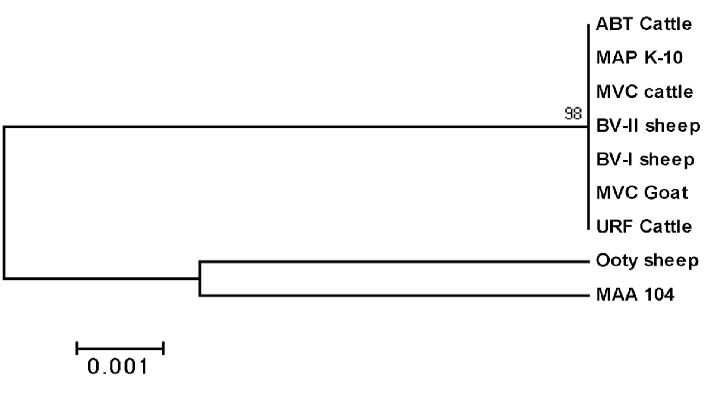
Phylogenetic tree of MAP isolates based on MAP 1506 locus


